| |
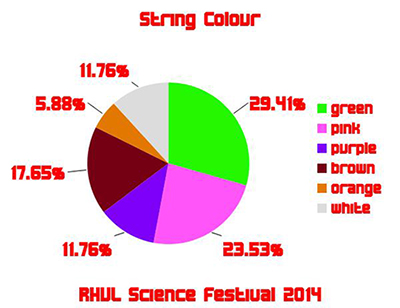
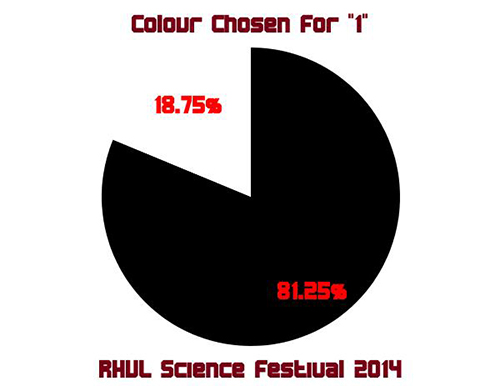
This information isn't particularly useful to me at the moment, but it could be if I compare colour preferences in different places, in different weathers, different times of year and so on. To do this, I'd want to standardise my colour scheme a bit more, and make sure there are the same colour string and beads.
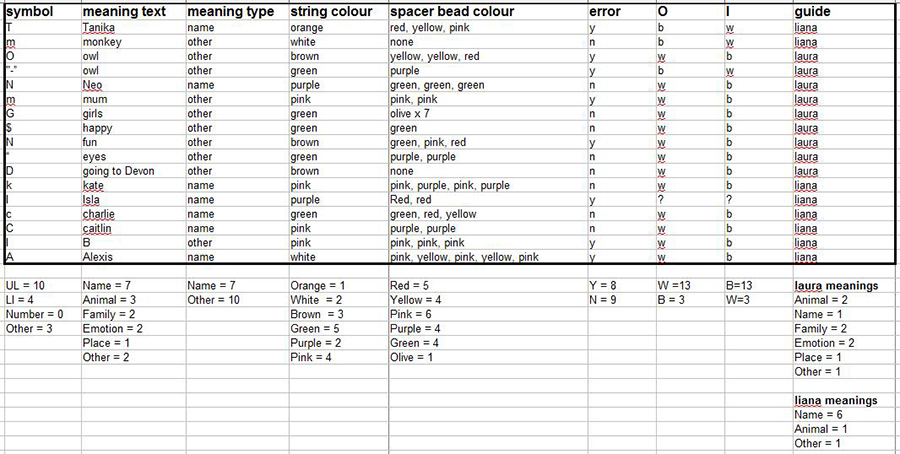
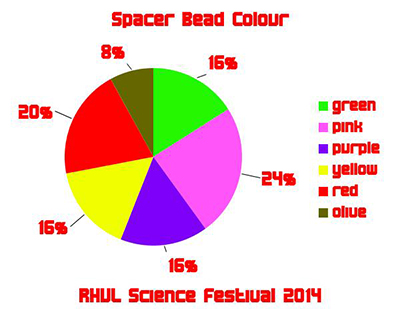
I was quite curious as to whether people would use the black and white beads as 0 and 1 equally, as there is no set way to do it. Clearly not. |
| |
|
| |
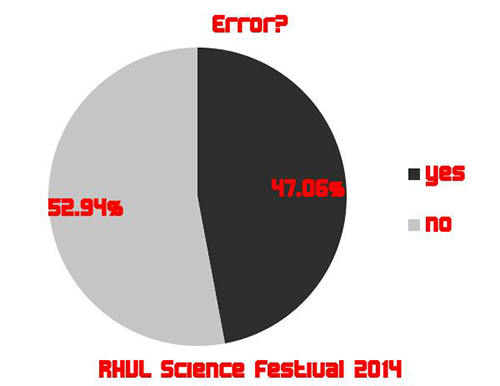
| In looking at the data, I was also interested to see that quite a lot of people made mistakes while threading the beads. I had planned to be quite strict about this, but on the day the atmosphere was such that it would have felt wrong to make people unthread things. There are many ways to tweak this in future. |
| |
|
| |
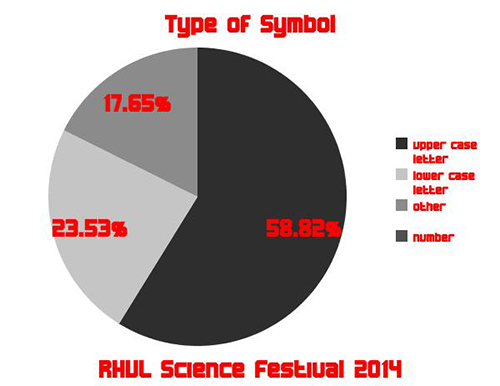
| When I originally planned this activity, I was intending to just have letters for people to choose from to make things simple. But as the process went on, I decided to include numbers and other symbols. I was curious to give people more of a choice how to represent what was important to them. I wanted to see how other people dealt with choosing symbols. |
| |
|
| |
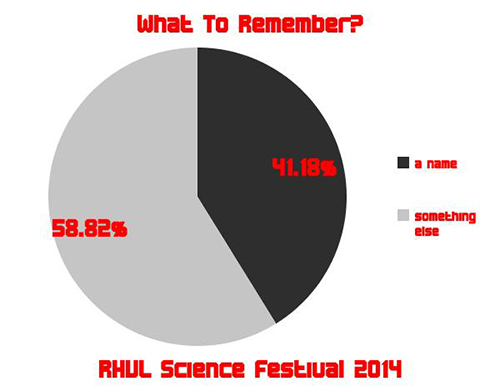
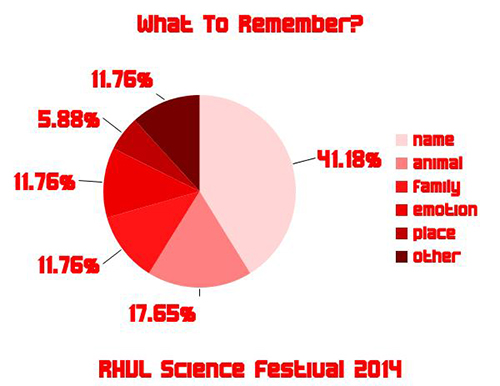
| One of the main things I want to look at is how to work with the more subjective kinds of information. I don't yet know how to do this. I think it is very hard to look at when the data is small, like this. But as things grow and get more complex, I will be able to see some interesting things here. I was surprised how many people chose to commit a name to memory. |
| |
|
| |
| I decided to look at this in a bit more detail. The data is very small, but it is still interesting. |
| |
|
| |
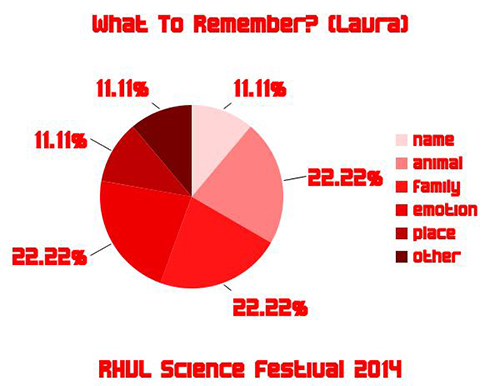
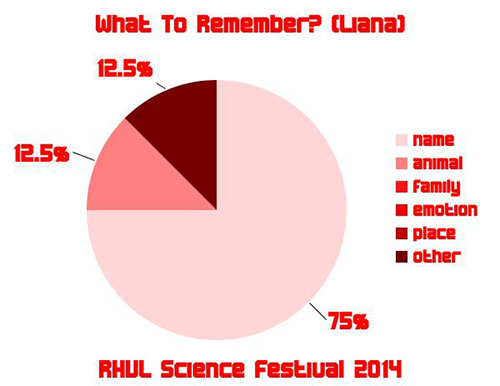
| As I only have one set of data at the moment, the amount I can explore with this is limited, but I am keen to see where this goes. One thing I was able to look at was the difference in responses depending on who is guiding the process. On the day, we were very busy. Home Live Art provided a volunteer, Liana Bortolozzo, to keep an eye on things. I like to make sure volunteers get a full experience, so she guided people through the activities too. I gave her my spare camera to record the data, and afterwards realised that this let me compare the information gathered by two different conversational approaches. As an artist whose work often involves conversation, I was very interested to see if there was something useful here, so I compared the results. |
| |
|
| |
|
| |
| The data I am drawing from here is tiny, but I think there are interesting things here for further exploration as the information gets richer. It is certainly a first step towards quantifying so-called "unquantifiable" audience experiences. I look forward to looking into this in depth. I aim to develop my understanding and use of data visualisation as the information grows, in the same way I have developed the rest of the project. |
| |
| |
| |
|
|